by Leon Ashcombe
Share
by Leon Ashcombe
Share
Yet another widely used tool in technical analysis to simplify price action and help traders spot market direction. Moving averages smooth data into a single line to show the overall trend rather than reacting to every small price fluctuation. The most common types include simple moving average (SMA) and exponential moving average (EMA). Though these look similar on charts, they act differently and are used in different trading approaches. Keep reading to learn more about moving averages.
Why Moving Averages are Important in Trading?
Markets usually do not move in straight lines. Prices fluctuate at all times, making it difficult to understand actual trends. Moving averages tackle this problem by filtering out short-term noise.
Traders use this method to understand whether a market is trending or ranging, lower emotional decision-making, and develop structured trading rules instead of guessing. Moving averages might seem simple, but they form the pillar of many advanced trading systems.
Simple Moving Average (SMA)
In this type of moving average, the average price is calculated over a fixed period where each data point is considered equally. As a result, it becomes stable and easy to understand. To be specific, a 230-day SMA shows the average closing price over the last 30 days without giving any preference to recent or older prices.
It offers answers to questions such as, ‘Is the market rising or falling?’, ‘Is the current price unusually high or low compared to recent history?’, and so on. A simple moving average is used by long-term investors for a clearer view of trend direction without being affected by short-term volatility.
Exponential Moving Average (EMA)
In this method, the calculation is adjusted to prioritize recent prices. As a result, it becomes faster and more sensitive to new market information. EMA reacts quickly to changes in price direction, which is beneficial in fast-moving markets like crypto and forex.
An exponential moving average is often used to spot early trend changes, time entries in fast markets, and follow short-term momentum. EMA produced more signals due to its sensitivity. However, not all of them are reliable without confirmation.
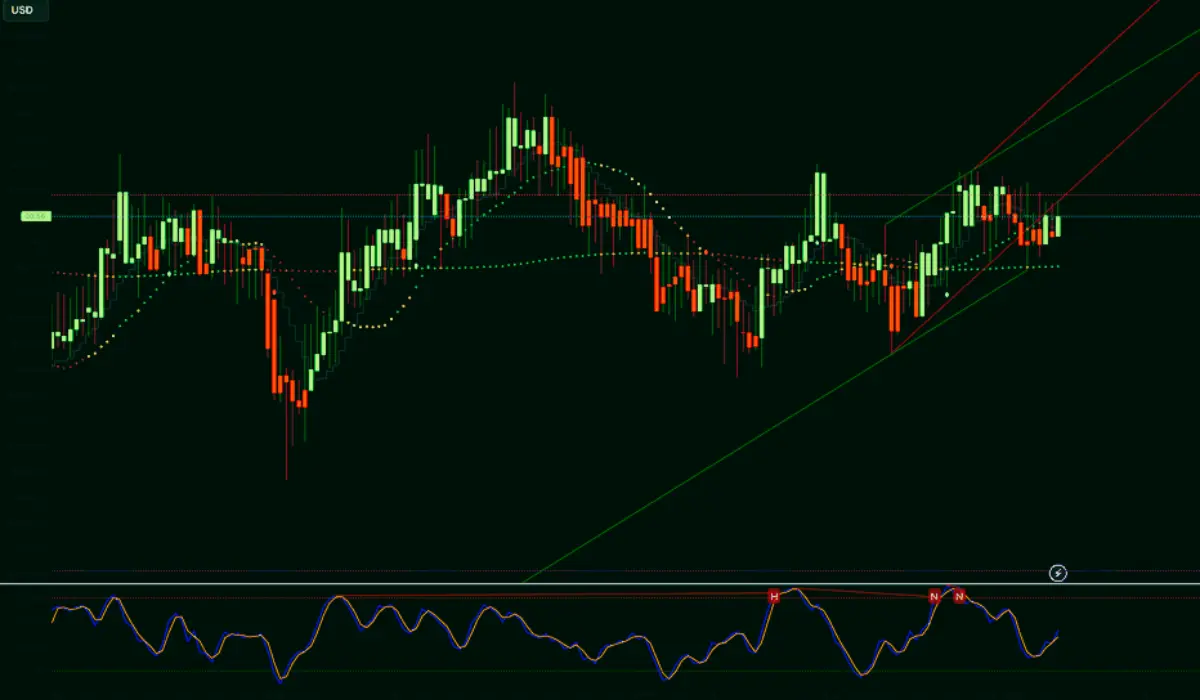
How SMA and EMA Behave on Charts?
Though the SMA and EMA indicators follow price trends, their behaviour is quite different.
- SMA moves smoothly and changes direction slowly
- EMA prioritizes price action and reacts quickly
It is during sharp market moves that these behavioral changes become visible. EMA turns earlier, while SMA confirms the trend later but more reliably. So, traders use both together for balance and speed.
A Practical Way Traders Use Moving Averages
SMA and EMA are, in effect, dynamic guides for market structure. A common approach is to use a combination like a 20-period EMA for short-term momentum and a 50-period SMA for long-term direction.
When both are aligned in the same direction, users consider the trend stronger. To be specific,
- Price above both averages indicates a bullish market
- Price below both averages indicates a bearish market
The Role of Crossovers in Real Trading
Crossover is a popular moving average technique where two moving averages intersect. Advanced traders consider this as a momentum shift rather than a strict buy/sell signal.
Here are what crossovers suggest:
- Short-term average crossing above long-term average- increasing upward momentum
- Short-term average crossing below long-term average- increasing downward pressure
They work best when the market is trending. In sideways markets, crossovers may generate false signals.
Using Moving Averages as Market Zones
Moving averages are used as areas of interest. Price does not always react precisely at a moving average; instead, it often reacts around it, pulls back toward it, or breaks through and retests it.
During retracements in trends, moving averages become beneficial as flexible support and resistance zones.
Strengths and Weak Points in Real Use
Moving averages, like other techniques, have both strengths and weak points. Let us look at each of them:
Strengths
- Even beginners can easily interpret
- Work across all financial markets
- Help structure trading decisions
Weaknesses
- Not much effective in sideways markets
- Always lag behind the price
- During fast reversals, it might give late signals
This is exactly why they are used together with other tools.
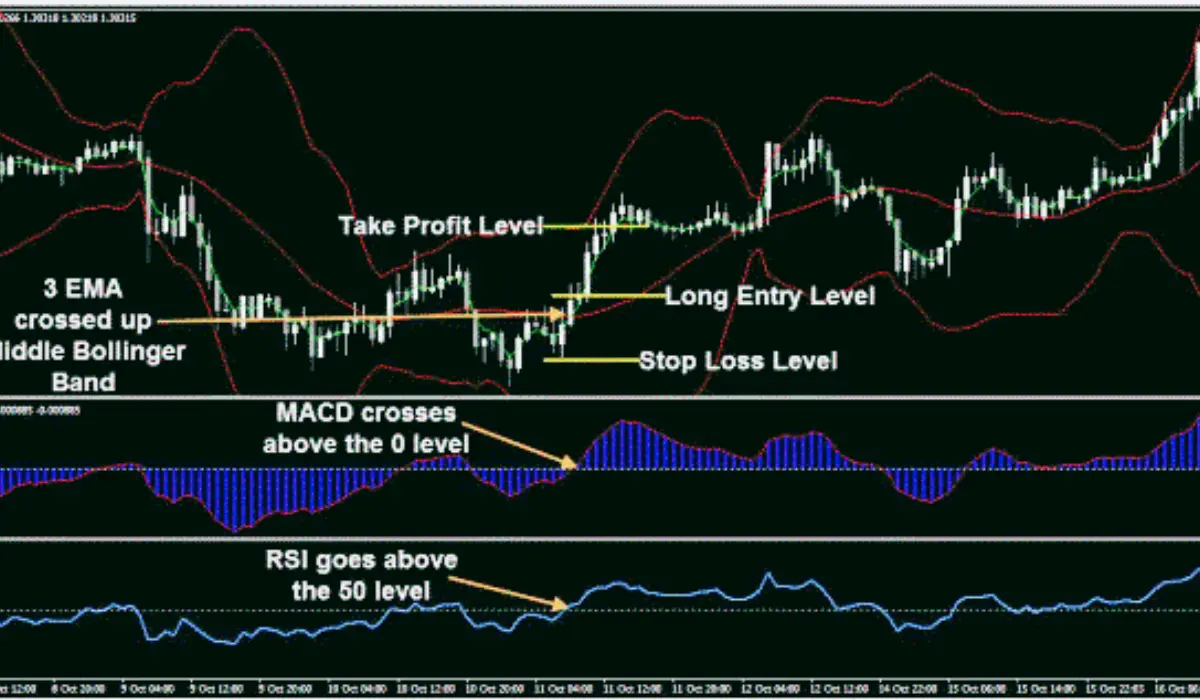
How to Use SMA and EMA Together
Traders often use both moving averages together.
- Using SMA to define long-term trend
- Using EMA to fine-tune entry Iming
- Check for price behaviour around both lines
So, instead of relying on one signal, this approach creates a complete view of the market.
Final Thoughts
Moving averages are one of the most practical tools in trading because they simplify complex price movements into clear structures and easily readable concepts. EMA offers speed and responsiveness, while SMA provides stability and a long-term perspective. By using these together, users can follow a system-based approach. They can be considered as guides that will help you understand market behaviour at the moment.
STAY IN THE LOOP
Subscribe to our free newsletter.
Leave A Comment
In trading, volume is an important indicator, but many traders focus on price movements instead. Though price indicates where the market is moving, volume shows the strength behind that movement. With proper analysis of trade volume, traders can have clarity about market sentiment, confirm trends, and spot potential reversals. Understanding volume analysis can help make

The way people send, receive, and store digital assets has completely changed with the introduction of blockchain technology. Whether you are trading NFTs, transferring cryptocurrency, or using decentralized applications (dApps), you might have come across the term “gas fees.” Many novice traders are surprised to know that blockchain transactions are not free. Having clarity about

Many traders focus on price movements and market trends while trading stocks, cryptocurrencies, or other financial assets. However, one important aspect that often goes unnoticed is the bid-ask spread. Gaining clarity about the bid-ask spread can help you reduce costs, make smarter trading decisions, and enhance your overall trading experience. In this article, we will
Technical analysis is important in understanding market movements and making wise trading decisions. The most widely used technical analysis tools are the Relative Strength Index (RSI), the Moving Average Convergence Divergence (MACD), and Bollinger Bands. They help traders spot trends, momentum, and potential entry and exit points in the market. In this article, we will