Technical analysis is important in understanding market movements and making wise trading decisions. The most widely used technical analysis tools are the Relative Strength Index (RSI), the Moving Average Convergence Divergence (MACD), and Bollinger Bands. They help traders spot trends, momentum, and potential entry and exit points in the market.
In this article, we will get into the details of these technical indicators, how they work, how to use them together, and more. So, keep reading.
What are Technical Indicators?
They are mathematical calculations based on an asset’s volume, price, or market activity. Technical indicators offer insights into potential future price movements and market trends. Most traders use these indicators to gain extra information before making major trading decisions.
Some popular indicators are RSI, Bollinger Bands, and MACD because they are quite easy to understand and can be used across cryptocurrencies, forex, stocks, and commodities.
What is the Relative Strength Index (RSI)?
This is a momentum indicator developed by J. Welles Wilder to calculate the magnitude and speed of recent price changes. It helps traders understand if an asset is overbought or oversold.
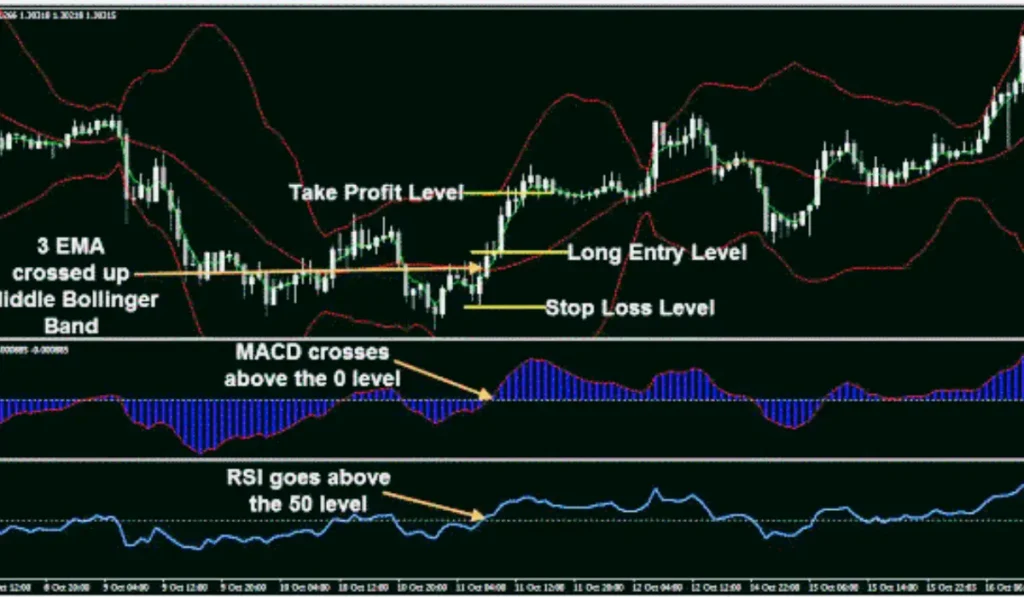
It is displayed as a value between 0 and 100. A 14-period calculation is the most common setting. Main RSI levels include:
- Above 70- Implies the asset may be overbought
- Below 30- Implies the asset may be oversold
- Between 30 and 70- Considered a neutral zone
When RSI goes above 70, some traders consider it a signal that buying pressure may be weakening. At the same time, when RSI goes below 30, it indicates that selling pressure may be slowing down.
Benefits
- Easy to understand
- Helps spot potential reversals
- Beneficial in both trending and range-bound markets
Limitations
- Might remain overbought or oversold for long periods during strong trends
What is Moving Average Convergence Divergence (MACD)?
This is a trend-following momentum indicator developed by Gerald Appel to help traders spot changes in trend direction and strength. It compares two moving averages of an asset’s price to form trade signals.
The three main components of MACD include MACD Line, Signal Line, and Histogram. Traders use MACD in various ways in different markets.
- Bullish crossover
A bullish signal happens when the MACD line goes above the Signal Line. This may suggest increasing upward momentum.
- Bearish crossover
A bearish signal happens when the MACD line goes below the Signal Line, signalling downward momentum.
- Divergence
Divergence happens when the price moves in one direction and the indicator moves in another, signalling a trend reversal.
Benefits
- Helps spot trend changes
- Blends trend analysis and momentum
- Suitable for different asset classes.
Limitations
- Since it is based on moving averages, it is a lagging indicator.
What are Bollinger Bands?
Developed by John Bollinger, it is a volatility indicator that helps traders measure volatility and spot potential price extremes. Bollings Bands consist of three lines:
- Middle Band- A 20-period Simple Moving Average (SMA)
- Upper Band- Middle Band plus two standard deviations
- Lower Band- Middle Band minus two standard deviations
The bands widen when market volatility increases, and it decreases when the bands contract.
Bollinger Bands are used to identify overbought and oversold conditions, identify volatility changes, and conduct trend analysis.
Benefits
- Checks market volatility
- Identifies breakout opportunities
- Simple to combine with other indicators
Limitations
- Touching the upper or lower band does not necessarily mean a reversal will happen. Extra confirmation is required.
Combining RSI, MACD, and Bollinger Bands
Professional traders use these indicators together because they offer different types of information.
- RSI calculates momentum and spots overbought or oversold conditions
- MACD tracks trend strength and potential reversals
- Bollinger Bands measure volatility and price extremes
When different indicators align, traders consider the trend stronger than when depending on a single indicator alone.
Common Mistakes to Avoid
While using RSI, MACD, and Bollinger Bands, novice traders often make the following mistakes:
- Depending on one indicator without confirmation
- Neglecting overall market trends
- Opening trades because an indicator reached a specific level
- Using indicators without proper risk management
To conduct successful trades, a combination of analysis, discipline, and risk control is a must.
Final Thoughts
RSI, MACD, and Bollinger Bands are the most popular and effective technical indicators to examine financial markets. RSI calculates momentum and spots overbought or oversold conditions, MACD tracks trend strength and potential reversals, and Bollinger Bands measure volatility and price extremes. While each indicator provides valuable information, combining them can help form a better trading strategy.
So, understanding how each of these indicators works and using them alongside effective risk management can help traders make smart decisions and enhance their overall market analysis.