Support and resistance levels are two important aspects in technical analysis. They are used to spot entry points, exit targets, price reversal zones, and risk management areas. By understanding these concepts, you can make wise decisions while trading stocks, crypto, forex, commodities, or other assets. This article details what support and resistance levels are, why they matter, the common mistakes to avoid, and the best timeframes for support and resistance.
What are Support and Resistance Levels?
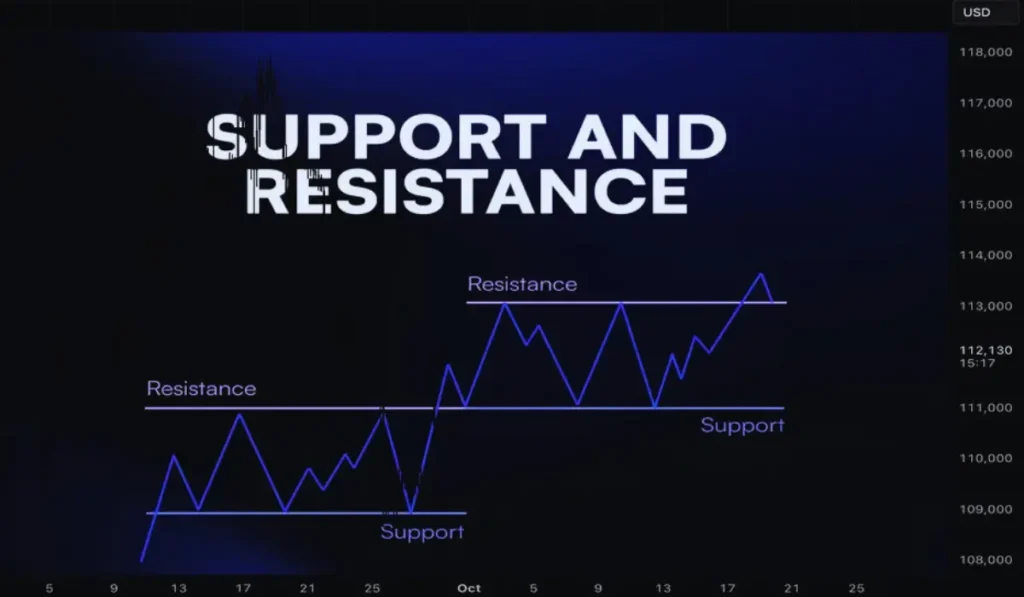
Support Level
Support level is a price level where an asset stops falling and starts moving upward. Experts say that it acts as a ‘floor’ because buying pressure increases so much that it overcomes selling pressure. For example, if a stock keeps falling to $50 and then rises higher, $50 becomes a support level.
Resistance Level
This is a price zone where an asset stops rising and starts moving downward. It is said that this acts as a ‘ceiling’ because selling pressure increases so much that it overcomes buying pressure. In case a stock rises to $100 various times but fails to move higher, $100 becomes a resistance level.
Why Support and Resistance Matter
Both support and resistance levels are important because they allow users:
- Spot market reversals
- Plan entry and exit points
- Examine market sentiment
- Set stop-loss levels
- Enhance risk-to-reward ratio
Traders and institutions use these levels widely, making them important tools in global financial markets.
How to Identify Support and Resistance Levels?
Traders and investors use various methods to identify support and resistance levels. Actually, they combine different techniques for confirmation.
1. Spot historical price levels
The easiest way to find support and resistance levels is by checking historical price action. For this, open a price chart, check for areas where the price repeatedly reverses, and mark zones where the market bounced up or down multiple times. The more times the price responds to a level, the stronger that level becomes.
2. Use Trendlines
These are diagonal support and resistance levels drawn by linking swing highs or swing lows. Connect higher lows to form a rising support trendline during an uptrend. At the same time, in a downtrend, connect lower highs to form a falling resistance trendline. Trendlines display potential reversal zones and market direction.
3. Moving Averages
They act as dynamic support and resistance levels. Common moving averages include the 50-day moving average, the 100-day moving average, and the 200-day moving average.
In uptrends, the price bounces from moving averages, while in downtrends, moving averages act as resistance. Well-known indicators include Simple Moving Average (SMA) and Exponential Moving Average (EMA).
4. Psychological Price Levels
Since traders naturally focus on round numbers, they become important support and resistance levels. For example, $100 in stocks, 1.2000 in forex, and $50,000 in Bitcoin. They lead to larger trading activity and can influence market behaviour.
5. Fibonacci Retracement Levels
This is used by traders to identify possible support and resistance levels during pullbacks. Common Fibonacci levels include 23.6%, 38.2%, 50%, and 61.8%. These are beneficial in trending markets.
6. Volume Analysis
High trading volume near a price level often boosts support or resistance.
Support and Resistance Trading Strategies
There are several support and resistance trading strategies that traders can use.
Bounce Trading Strategy
The bounce trading strategy assumes the price will bounce from support or resistance. For example, buy near support and sell near resistance.
Breakout Trading Strategy
This happens when the price moves strongly above resistance or below support. In bullish breakouts, the price breaks above resistance, while in bearish breakouts, the price falls below support.
Role Reversal Concept
This is an important concept in technical analysis. Broker support can become new resistance, and broken resistance can become new support. The reason for this reversal is changes in market psychology after a breakout.
Common Mistakes While Using Support and Resistance
While drawing support and resistance levels, many users make some common mistakes. These are as follows:
- Creating exact lines instead of zones
- Overcrowding charts
- Ignoring market context
- Trading every touch
Best Timeframes for Support and Resistance
They can be used on all timeframes.
- Short-term traders use 5-minute charts, 15-minute charts, or 1-hour charts.
- Swing traders use 4-hour charts or daily charts.
- Long-term investors use weekly charts or monthly charts.
Usually, higher timeframe levels are stronger and more reliable.
Conclusion
For everyday traders, support and resistance levels are important tools that help spot breakout opportunities, risk management areas, and potential turning points. Combining these levels with volume, trend analysis, and confirmation signals will help enhance trading accuracy to a great extent. Beginners can start with simple horizontal levels and gradually try advanced techniques.